

Cards and the showcase
Every card type, what it needs, and how to try them with made-up readings.
Layout editor
Arrange cards, build several dashboards, and choose what opens on computers and phones.
Device controls
Change inverter and battery settings safely from the Controls page.
The layout editor's library has every card, grouped the same way as on this page. Cards that draw energy flows, charts, tables, costs or savings work from your metric roles, so it's worth setting those up first.
Try them in the showcase
The showcase, at /showcase, shows every card filled with made-up readings from an imaginary home that
change every few seconds. It's the easiest way to see what each card can do: play with its options
(size, titles, time periods, styles, layouts) as much as you like. Nothing on that page touches your data or
your devices. You'll need to be signed in to open it.
Energy flow
| Card | What it shows |
|---|---|
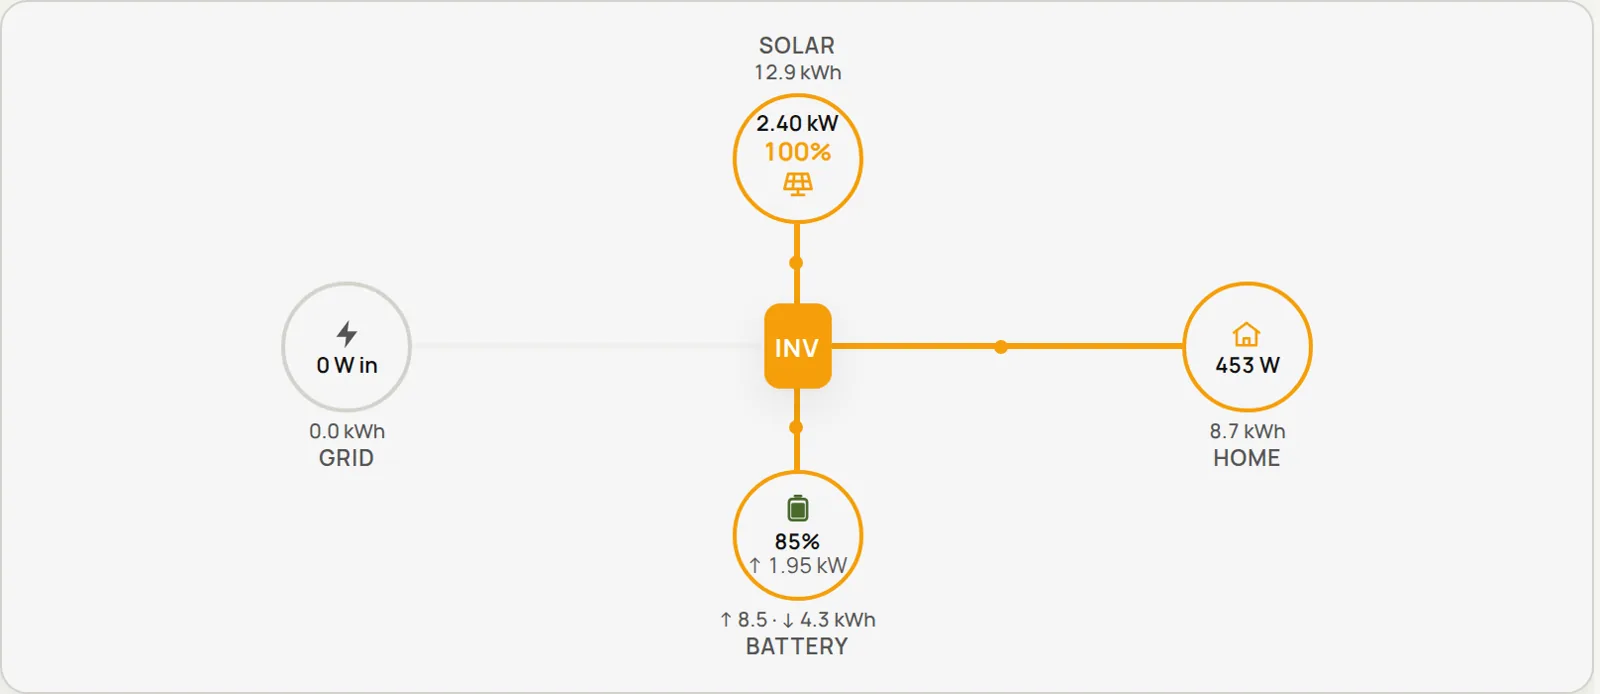
| System topology | An animated flow between solar, battery, grid and home |
| System overview | Grid, battery, solar and home tiles with 24-hour sparklines, arranged around the inverter |
| Flow card | Power flow, with an optional solar gauge |
| Flow square | A square flow layout with a picture of your inverter |
| Flow square, alternate | The same square layout without the inverter picture |
| Power flow | Where the power comes from on the left (solar, and battery, grid or generator when they are active) and where it goes on the right (home, battery, grid export) |
These use the power roles, or the metrics you pick on the card.
Power flow
Solar and Home are always shown. Battery, Grid and Generator appear only while they are doing something: the battery on the left while it discharges and on the right while it charges, the grid on the left while you import and on the right while you export, and the generator on the left while it runs. A battery or generator you haven't set up never shows. In the card's settings you can turn the Grid, Generator, Battery-as-a-source and Grid-export entries off, rename the title (empty hides it) and pick the metric behind each value. The card fills whatever size you give it: rows, text and icons follow its height, and on very small cards the labels and title drop away instead of overlapping.
Values
| Card | What it shows |
|---|---|
| Metric cards | A row of big single values |
| Metric trend | A live value, with an optional history or forecast graph |
| Dual metric | Two live values side by side |
| Multi-value list | Rows of labels, values and units |
| Text metric | One metric's current value as text |
| Grid status | Whether the grid is on or off, the hours, a 24-hour timeline, and optionally costs and hours per day |
| Prepaid meter | The units left on a prepaid electricity meter, days left, and buttons to record a recharge or correct the balance |
| Status list | A dot per device or circuit that lights while its metric says it is on |
| System hero | A title and a headline over a picture, with a status pill under it, all following rules |
| Flow rows | A row per destination with a bar and its value, and a word such as Idle when it is not flowing |
| Meter card | A big value with a segmented bar against a target, and up to two lines of words |
| Generator status | Whether the generator is running or off, how long it has run, a 24-hour timeline, and optionally costs and hours per day |
| Day totals | Today's energy to and from the grid, consumption and solar, compared with the forecast |
| Savings | What you've saved today, this week, month, year and in total |
Grid status needs a grid status metric, Generator status needs a generator status metric or generator power, and Savings needs the daily solar role plus your prices.
Icons on value cards
Metric cards, Multi-value list and Text metric can show an icon beside each value. Type an
icon name (the field suggests names as you type, for example solar-power or battery), an emoji, or the
address of an image (https://… or a path starting with /). Leave it empty and the tile looks as it
always has. An image that fails to load is dropped, so a broken link never leaves an empty frame.
Gauges and bars
| Card | What it shows |
|---|---|
| Gauge | One value on a round dial |
| Configurable gauge | A dial you can configure fully, with coloured bands and history |
| Half gauge | One value on a semicircle |
| Half gauge, centre zero | Zero at the top, filling to the right, or to the left for negative values |
| Ring gauge | Up to three concentric rings, each filling for a metric, with the first two read out in the middle |
| Battery | A battery that fills to the charge, with a charge scale, a current marker and small readings below |
| Speedometer | A dial with a needle, a status in plain text that follows rules (such as near today's peak), and a line of words under it |
| Bar gauge | Bars for several metrics, in rows or columns |
| Bar gauge, segmented | LED-style segmented bars for several metrics, in rows or columns |
| History bars | One metric's history as coloured vertical bars |
| Stacked history bars | Several metrics stacked up in each time slot |
| Threshold bar | One value against coloured bands |
These work with any metric.
Ring gauge
Pick up to three metrics. Each gets a ring, the first on the outside, and fills from the lowest to the highest value you give it, so a 5 kW array wants a highest of 5000 (W). The first two metrics are read out in the middle, with their labels; a third is listed under the dial. An optional icon (an icon name, an emoji or an image address) sits above the first reading, and Show the empty ring behind each one turns the faint track on or off. Each ring has its own colour. A typical set is solar on the outer ring and consumption inside it.
Battery
The battery fills to the charge metric, with a 0 to 100% scale beside it and the charge in big type below. The fill is red at or below one limit (20% by default), amber at or below another (50%) and green above, or one colour of your own. Give it a current metric and a marker on a vertical track shows the battery charging (above zero) or discharging (below), with the amps under the charge; Marker range sets what the ends of the track mean, 100 A by default. The marker's labels and the amps use the unit of the current metric. Up to four small readings run along the bottom, for example the inside and outside temperature.
Status list
One row per device, circuit or appliance, each with a metric. A row's dot lights while it is on: the metric says
on (or true, yes, active, running), or is above 0. For a power reading choose On when above the limit, such as a
boiler above 50 W. Show how many are on adds "3 of 6 on" to the title, and Show each row's value puts the
reading beside the name. A row with no reading yet shows an empty dot. Each row can have its own dot colour.
Every word on the card is yours to set: the count line (write {on} and {total} where the numbers go, for
example {on}/{total}), and the words for on and off shown by a row that only says on or off. Left empty they
are the English {on} of {total} on, On and Off.
All three scale with the card, so they work at any size, and they take the same colour, transparency and glass settings as the other cards.
System hero
A small title and a headline over a picture, such as an illustration of your house, with a status pill under it: a
dark pill with a dot in the state's colour. The headline and the pill come from the States: each row has a rule, a
headline and a pill text, and the first row whose rule is true wins. Rules are the same as on the Status list:
When it says on, or is above 0, When above the limit or When below the limit. A row with no metric always
applies, so put it last as the fallback, for example "Waiting for the sun". Picture is a web address or a path
starting with /; a picture that fails to load is dropped. Layout puts the picture under the words (the default) or
beside them; a card too short for the picture under the words is drawn side by side, and a narrow side-by-side card
leaves the picture out. Each state can have its own dot colour.
Speedometer
A dial for one metric between Lowest and Highest, with both written at the ends of the arc. The reading is in the middle, with the highest beside it ("4.20 kW of 6.40"). The highest can come from a metric, such as your system size, which replaces the number while it has a reading. There are two lines of words:
- A status in plain text at the right of the title row. It follows the first of its rules that is true, so it can say "Near today's peak" at that moment and something else the rest of the day. A rule is Near today's peak (the reading is at least a share of the peak, 85% unless you change it), At or above or Below a share of the highest value, or Always, the fallback to put last. For the peak, pick a metric that holds today's peak, for example a Highest today combined metric; without one, the near-peak rule is never true.
- A line under the dial, with the percentage in the accent colour, for example
{pct}% of system size.
Both can hold {value}, {max}, {peak}, {pct} (the reading as a percentage of the highest) and the
extra readings.
Flow rows
A row per destination (or source) of energy, on one line: its label, a bar and its value. A row below a small limit shows a word such as Idle instead of its value, and its bar shrinks to a short grey stub. The limit is in watts for a W or kW reading and in the metric's own unit for any other. A bar fills against the row's own highest value, or against the largest row when that is empty, so the rows compare with each other. The first three bars are in the accent colour, the text colour and grey unless you pick colours. Count only positive values (or only negative) follows one direction of a reading that goes both ways, such as battery power: a row that shows only the charging.
Meter card
A label, a big value and a bar under it, with up to two lines of words below. The bar can follow the value itself or
another metric, and fills between Empty at and Full at; Full at can be a metric, such as the forecast for
today. It is made of segments (set Segments to 0 for one continuous bar) and can turn red and amber below the
percentages you set. Before the value puts a currency or other sign in front. The lines can hold {value}, {max},
{pct} (how full the bar is) and the extra readings.
Some things this makes easy:
- Made today: the value is the day's solar energy, Full at is the
forecast_solar_todaymetric, and the line is~{max} expected today. - Saved today: the value is the
savings_todaymetric with the currency in Before the value. Make the bar follow a percentage metric of your own, with the line{pct}% from your own power. - Battery: the value is the charge, red below 20 and amber below 50, with extra readings for the power, the energy
stored and the capacity, and the line
{a} · {b} of {c}.
Words on the new cards
Every word on these cards is yours to set, so none is tied to a language. Where a card has words it also has up to
three extra readings, called {a}, {b} and {c} in the order you list them: a number, such as the count of
panels producing, or a text metric. Put them in a headline or a line, for example All {a} panels producing. An extra
reading can put a + before a positive value, which suits a power that is charging when positive. A word that holds
something else in braces is left as you wrote it. Speedometer, Flow rows and Meter card have a Decimals setting
(0 to 3); left empty, the number of decimals follows the size of the value, as on the other cards.
Prepaid meter
For a prepaid electricity meter: the units (kWh) left in big type, a bar of segments against the last recharge, the days left at your recent average, and four facts (used today, average a day, used since the last recharge, the price of the last recharge). It turns red from the warning level you set, and when the meter is out. Tracking is set up under Settings → Prepaid meter; until then the card shows a note.
When you are signed in the card also has the buttons Record recharge and Correct balance, which only record
what you did by hand: Epilykos cannot buy a token or read the meter. Undo last takes back the latest entry. Show
the latest entries adds a short history, shown with symbols and numbers only (+ for a recharge, = for a
correction). A short card gives up the entries first, then the facts. Everyone else sees only the figures, or nothing
at all if you chose to keep the balance private.
Every word is yours to set (the labels, the days-left line, the messages), with the English words as the default. The
days-left line can hold {days}, {avg} and {date}; a part of it after a · that needs the date is left out when
there is none. Segments and Decimals work as on the Meter card.
Prepaid meter on the Grid card
The Grid status card can show the balance as plain text at its top right, level with the date: the units left,
and under it the days left ("178 units left", "≈ 50 days at 3.5 units a day"). Turn on Show the prepaid meter balance
on this card in its settings. There is no bar. The text is quiet while all is well, turns red from the warning level
you set in Settings → Prepaid meter, and reads "Out of units" in red at 0. It only appears
while tracking is on and has a balance. The words are settings too: {balance}, {days} and {avg} stand for the
numbers. With the option off, or tracking off, the card is as it always was.
Remaining solar today
Epilykos keeps a metric called forecast_solar_remaining (kWh): what is still expected from the forecast for the rest
of today, counting the half hour in progress for the part that is left. Use it on a Metric card or a Text metric
card for "Remaining solar today".
Two more metrics are kept for these cards. forecast_solar_today (kWh) is what the forecast expects over the whole of
today, for "of the expected" bars; it is worked out from a forecast that still has the morning in it, and kept
through the day. savings_today is today's savings in the currency you set under
prices and savings, the same figure as the Savings card's today.
The two bar gauges have a Bars section in their settings:
- Orientation is Horizontal (rows), the usual layout, or Vertical (columns). Vertical shows one column per metric, with the value on top, the label below, and the bar filling up from the bottom. On the segmented gauge the segments stack from the bottom up.
- Bar ends is Default, Rounded or Square, for the bars and for each segment.
Both are left as they were until you change them.
The bars follow the size of the card. Make the card taller or wider and the bars, labels and values grow with it, in either orientation; on a small card they shrink to fit instead of overflowing.
Charts and tables
| Card | What it shows | Needs |
|---|---|---|
| Power chart | Solar, load, battery and grid power over the last 24 hours or 3 days, plus the generator whenever it ran | The power roles |
| Energy chart | Daily solar, grid and load energy as bars (the last 7 days by default) | The daily energy roles |
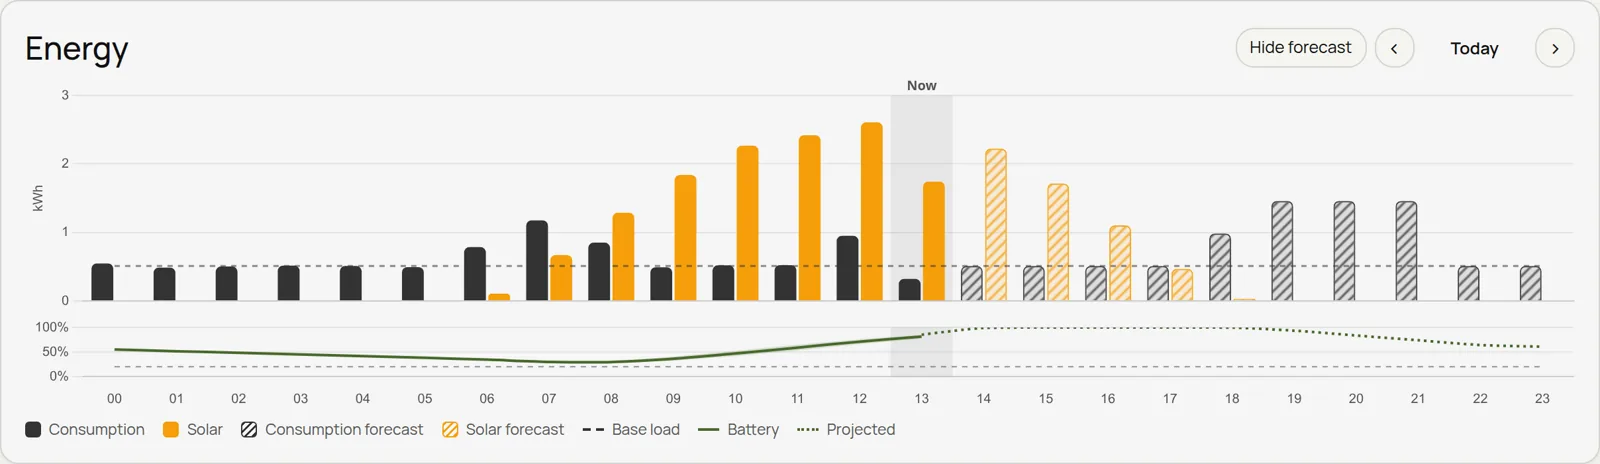
| Energy day | Hourly consumption, solar and generator with the forecast, and the battery's charge | The power roles |
| Daily peak | The highest solar power of each day as bars, over the last 30 days, 90 days or year; or any metric's daily highest | The solar power role, or any metric |
| Histogram | How often each power level happens: days counted by their peak, or hours counted at each solar power | The solar power role, or any metric |
| Energy flows | Where each hour's energy came from and where it went | The power roles |
| Costs and earnings | Hourly grid and generator costs, grid earnings and battery wear, with totals for the day | The power roles and your prices |
| Energy, tabbed | Energy day, flows, costs and day totals in one card | As above |
| Metric chart | Any metrics over time, with units and scale | Any metric |
| Daily table | Energy totals for each of the last 30 days | The daily energy roles |
| Monthly table | Energy totals for each of the last 12 months | The daily energy roles |
Forecast and weather
| Card | What it shows |
|---|---|
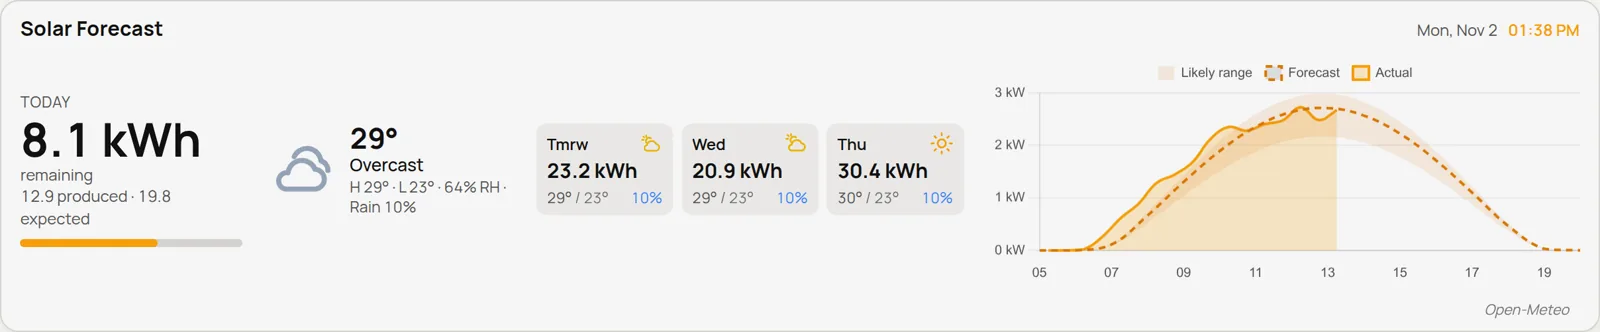
| Solar forecast | Today's production, the next few days, the weather and a chart |
| Solar forecast summary | Today and the next few days, without the chart |
| Solar forecast chart | Today's actual solar power against the forecast |
| PV today | A summary bar, a weather timeline and a chart |
| Weather | Current conditions, the forecast and any alerts |
These need Forecast and weather to be set up.
Controls
| Card | What it does |
|---|---|
| Toggle switch | Turns something on or off |
| Button | A big icon button: tap to toggle, turn on or off, or press |
| State select | Picks one of several states |
| Slider | Drag to set a number, such as a charge current or a level |
| Rotary knob | Turn a knob to set a number |
Control cards only work on the Controls page; if you put one on a dashboard, it shows a link to that page instead. They can control Tuya devices, Home Assistant entities, MQTT topics and inverter and battery settings. See Device controls.
Text and embeds
| Card | What it shows |
|---|---|
| Text | A note or heading you write yourself |
| Embed | Another web page, shown inside the card |
Last updated on