

Metrics
Metric roles, combined metrics and the list of every reading.
Install as an app
Put Epilykos on your phone or computer like an app, and let it switch between home and away addresses.
Virtual Battery
A battery charge Epilykos works out itself, for inverters that cannot read the battery directly.
Settings → Metrics lists every value Epilykos records, and is where you tell it which reading plays which part in your charts and cards.
Metric roles
Here you tell Epilykos which of your metrics is the solar power, which is what the house is using, which is the battery, the grid, the generator and so on. The power chart, your history, the daily and monthly tables, the energy cards and your savings all depend on these roles. The setup wizard fills them in for you, and you can adjust them here at any time.
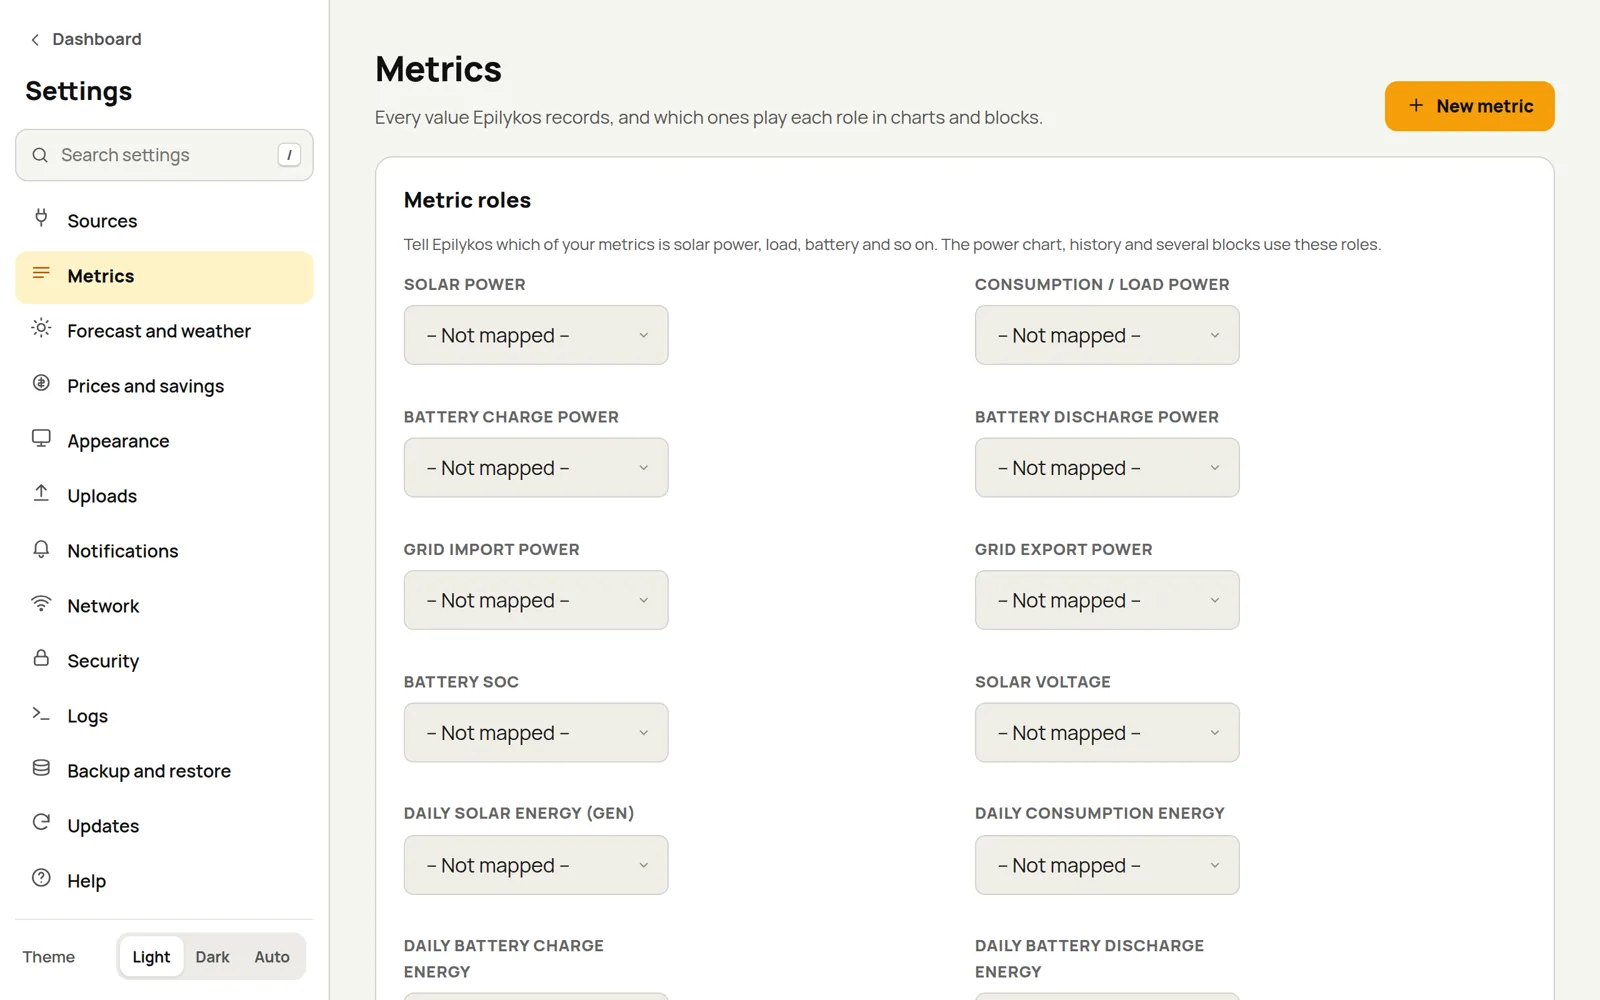
Core concepts lists every role with typical metric names.
Combined metrics
Combined metrics let you add up readings from several inverters, MPPTs or batteries, or work out energy from power. Each result becomes a new metric that you can use in roles and on cards. Press Add combined metric and choose what to do:
| Calculation | What it does |
|---|---|
| Add up | Adds all the inputs together, for example PV1 + PV2 from each inverter. |
| Average | The average of the inputs. |
| Lowest / Highest | The lowest or highest of the inputs. |
| Subtract | The first input minus the others, for example load minus solar. |
| Multiply | Multiplies the inputs, for example voltage × current = power. |
| Weighted average | An average where each input counts by its weight, for example battery charge weighted by capacity. |
| Scale | One input × a factor + an offset, for example Wh to kWh with a factor of 0.001. |
| Energy today from power | The kWh so far today, worked out from a power reading. Starts again at midnight. |
| Lifetime energy from power | A kWh total that only ever goes up. You can give it a starting value to match a meter. |
| Today's increase of a counter | How much a lifetime counter (such as total kWh) has gone up since midnight. |
| Average per day | The average of a daily figure over the days on record, for any one metric. See Average per day. |
| Highest today | The highest value so far today (inputs are added first, for example every PV string for the day's peak solar power). It starts again at midnight, so the last value of each day is that day's peak. Use it for the Daily peak and Histogram cards. It starts from when you save it; earlier days have no peak. |
| On/Off from a limit | Turns one input into On or Off, depending on whether it is past a limit you choose. See On/Off metrics. |
Sums and averages can be shown split into their parts on cards. Switch a combined metric off if you want it to stop being calculated.
Average per day
Average per day answers questions like "what is my average daily load?" or "how much solar do I make on a typical day?". Pick one metric (solar, load, grid, battery, generator, a voltage, anything) and say what each day's figure is:
| Each day's figure is | Use it for |
|---|---|
| The day's total | A reading that counts up through the day and starts again at midnight, such as an energy-today metric or an inverter's daily kWh. The highest value of each day is that day's total. |
| Energy from power (kWh) | A power reading, such as load power or solar power. Each day's kWh is worked out from it, and you say whether the power is in W or kW. |
| The day's average | A reading you want the typical value of, such as battery voltage or temperature. |
| The day's highest | The peak of each day, such as the highest solar power. |
Then choose Average over every day on record, or the last number of days you give, and whether to Include today so far.
- It works from the history the app already keeps, so the figure is right as soon as you save it. There is nothing to wait for, and it covers days from before you made the metric.
- Only complete days count. Today is left out unless you ask for it, and so is the first day on record if its readings began more than an hour after midnight.
- A day with no readings is left out; it is not counted as zero. A day with readings that say 0 (a generator that did not run) does count.
- Energy from power counts only what was recorded, so a day with gaps in the readings counts a little less.
- The result changes once a day (every ten minutes if you include today). The metrics list shows how many days it covers. Use it in a role or on any card, like any other metric.
On/Off metrics
On/Off from a limit makes a status out of any reading. The result is a normal metric that reads 1 when it is On and 0 when it is Off, shown as On or Off in this list. For example, a grid status from the inverter's grid voltage:
Press Add combined metric, name it (for example grid_status) and choose On/Off from a limit.
Add the input, for example grid_voltage. This calculation takes one input.
Choose at or above (or at or below) and enter the value it turns On at, for example 180.
Optionally enter a different value for Turns Off when it is below, for example 160. Press Preview to see what it reads now, then Save.
With only the On value, it is a plain comparison: On at 180 V and above, Off below. A different Off value leaves a gap between the two. While the reading is inside the gap, the metric keeps its last state, so a voltage that hovers around 170 V doesn't flip On and Off and count as a string of outages. If the very first reading is inside the gap, it starts Off.
Some more uses:
| Status | Input | Turns On |
|---|---|---|
| Generator running | Generator voltage or power | at or above a small value |
| Battery full | Battery charge (%) | at or above 100 |
| Battery low | Battery charge (%) | at or below 20, Off above 25 |
| Charging | Battery power | at or above 50 |
If the input stops updating, the metric waits and keeps its last state instead of switching, so an inverter that goes offline doesn't look like an outage. Under When readings are late you can choose Count it as 0 instead, which makes it Off.
When you have a grid voltage metric, Epilykos suggests this calculation as Grid status (On/Off) above the list. Use the metric as your grid status metric, and as the generator status metric for a generator.
Some inverters keep showing a grid voltage when the grid is lost. A limit can't tell the difference, so check what yours reads during a real outage before you rely on it.
If several BMS packs make up one battery, a battery bank is the
better fit; its bank_ metrics can be used here too.
All metrics
This list shows everything your sources and combined metrics report, newest first, with each one's current value, when it last changed and its unit. Metrics that haven't had a reading yet are at the bottom. Use the filter to find one, and if there are metrics you no longer use, select them and press Delete selected.
Last updated on